Note: The 2021-22 fiscal year spanned from April 1, 2021 to March 31, 2022. All material economic and fiscal implications known as of June 1, 2022 have been considered in preparing the Annual Report.
Year Ended March 31
| 2022 | 2021 | |||||
|---|---|---|---|---|---|---|
| Budget (Note 3) | Actual | Actual | ||||
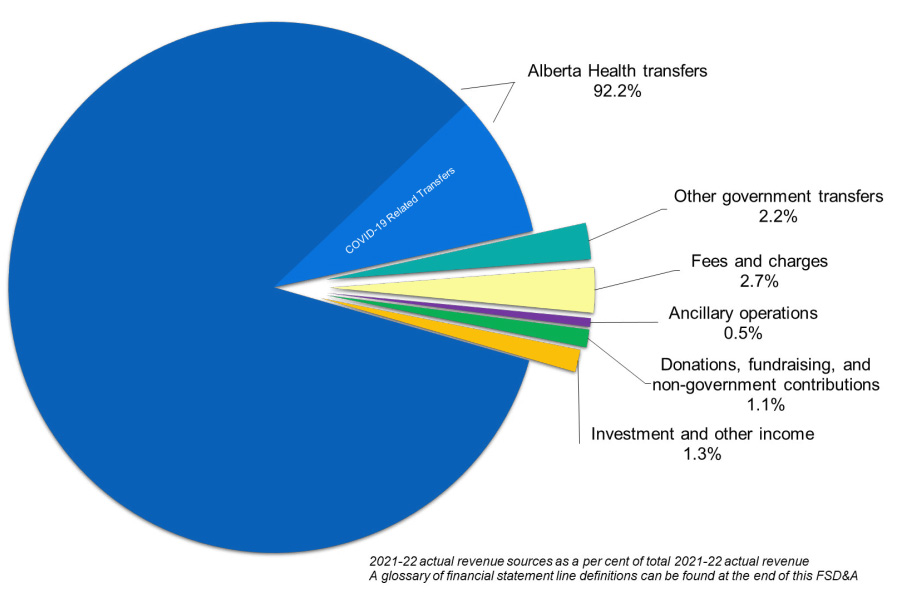
| Revenues | ||||||
| Alberta Health transfers | ||||||
| Base operating | 13,099,000 | 13,097,557 | 12,756,769 | |||
| One-time base operating | - | 71,003 | 145,566 | |||
| Other operating | 1,374,000 | 2,859,669 | 2,480,646 | |||
| Recognition of expended deferred capital revenue | 61,000 | 95,777 | 76,407 | |||
| Other government transfers (Note 4) | 455,000 | 382,887 | 461,929 | |||
| Fees and charges | 525,000 | 478,313 | 421,523 | |||
| Ancillary operations | 145,000 | 91,369 | 53,546 | |||
| Donations, fundraising, and non-government contributions (Note 5) | 177,000 | 185,893 | 184,874 | |||
| Investment and other income (Note 6) | 160,000 | 236,292 | 207,826 | |||
| TOTAL REVENUES | 15,996,000 | 17,498,760 | 16,789,086 | |||
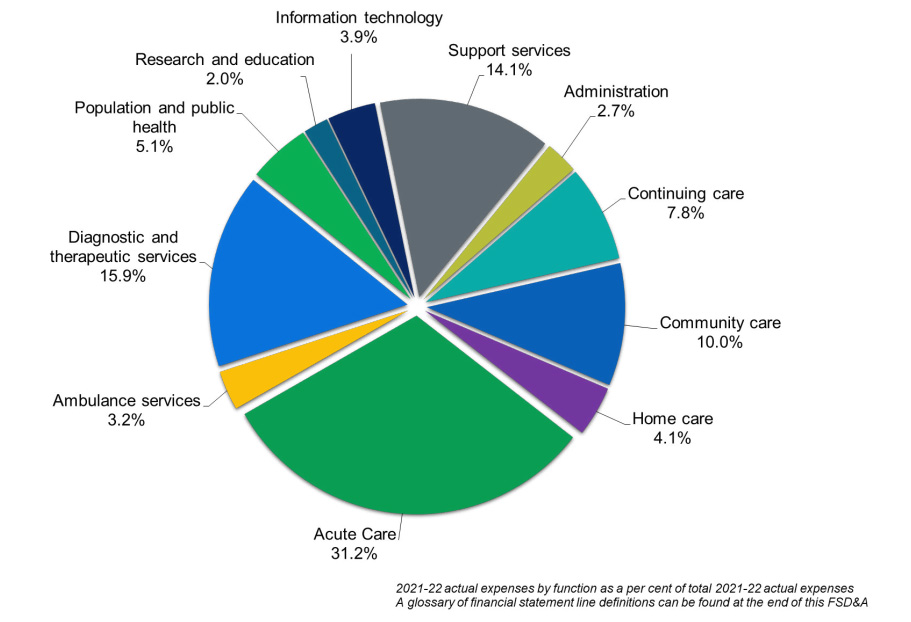
| Expenses | ||||||
| Continuing care | 1,222,000 | 1,357,126 | 1,318,537 | |||
| Community care | 1,624,000 | 1,731,760 | 1,666,107 | |||
| Home care | 736,000 | 709,715 | 680,119 | |||
| Acute care | 5,017,000 | 5,423,320 | 5,221,723 | |||
| Ambulance services | 544,000 | 557,720 | 542,463 | |||
| Diagnostic and therapeutic services | 2,577,000 | 2,757,593 | 2,725,780 | |||
| Population and public health | 357,000 | 876,457 | 754,294 | |||
| Research and education | 347,000 | 351,106 | 333,252 | |||
| Information technology | 724,000 | 677,737 | 626,792 | |||
| Support services (Note 7) | 2,359,000 | 2,447,719 | 2,324,094 | |||
| Administration (Note 8) | 489,000 | 466,012 | 492,253 | |||
| TOTAL EXPENSES (Schedules 1 and 3) | 15,996,000 | 17,356,265 | 16,685,414 | |||
| ANNUAL OPERATING SURPLUS | - | 142,495 | 103,672 | |||
| Accumulated surplus, beginning of year | 1,236,000 | 1,236,273 | 1,132,601 | |||
| Accumulated surplus, end of year (Note 20) | 1,236,000 | 1,378,768 | 1,236,273 | |||
The table below provides a snapshot of AHS activity and demonstrates service level changes over the last few years.
| 2018-19 | 2019-20 | 2020-21 | 2021-22 | |
|---|---|---|---|---|
| Primary Care / Population Health | ||||
| Ambulatory Care Visits | 6,578,463 | 6,137,600 | 5,175,278 | 5,452,962 |
| Number of Unique/Individual Home Care Clients | 119,862 | 124,975 | 117,775 | 121,560 |
| Number of People Placed in Continuing Care | 8,098 | 8,521 | 7,427 | 8,664 |
| Health Link Calls* | 694,313 | 891,931 | 2,291,243 | - |
| Health Link Calls Received – Clinical* | - | - | - | 1,444,868 |
| Health Link Calls Received – Non-Clinical* | - | - | - | 2,291,770 |
| Health Link Outbound Calls – Clinical* | - | - | - | 59,775 |
| Health Link Outbound Calls – Non-Clinical* | - | - | - | 494,208 |
| Poison Information Calls (PADIS) | 38,785 | 39,253 | 38,718 | 48,392 |
| Seasonal Influenza Immunizations** | 1,317,659 | 1,438,682 | 1,650,836 | 1,291,770 |
| EMS Events | 560,434 | 589,498 | 602,283 | 672,898 |
| Food Safety Inspections | 65,560 | 48,247 | 26,171 | 33,728 |
| Acute Care | ||||
| Emergency Department Visits (all sites) | 2,056,631 | 2,062,528 | 1,552,096 | 1,824,116 |
| Urgent Care Visits | 197,401 | 202,925 | 148,166 | 193,961 |
| Hospital Discharges | 401,208 | 399,281 | 358,107 | 375,960 |
| Births | 50,793 | 49,981 | 46,603 | 47,292 |
| Total Hospital Days | 2,853,001 | 2,852,150 | 2,505,858 | 2,613,603 |
| Average Length of Stay (in days) | 7.1 | 7.1 | 7.0 | 7.0 |
| Diagnostic / Specific Procedures | ||||
| Hip Replacements (scheduled and emergency) | 6,279 | 6,605 | 5,802 | 6,177 |
| Knee Replacements (scheduled and emergency) | 6,617 | 6,233 | 5,125 | 5,273 |
| Cataract Surgery | 40,554 | 45,236 | 44,289 | 47,744 |
| Main Operating Room Activity | 291,450 | 289,567 | 271,131 | 271,375 |
| MRI Exams | 204,744 | 201,118 | 205,793 | 235,241 |
| CT Exams | 441,938 | 427,508 | 462,443 | 508,071 |
| X-rays | 1,845,811 | 1,846,918 | 1,532,099 | 1,697,532 |
| Lab Tests | 80,237,687 | 80,528,613 | 72,491,239 | 82,149,662 |
| Cancer Care | ||||
| Cancer Patient Visits (patients may have multiple visits) | 668,817 | 704,191 | 737,212 | 794,799 |
| Unique/Individual Cancer Patients | 59,249 | 62,513 | 60,902 | 64,496 |
| Addiction and Mental Health | ||||
| Mental Health Discharges (acute care sites) | 25,725 | 26,443 | 27,100 | 27,991 |
| Mental Health Discharges (acute care sites and standalone psychiatric facilities) | 29,936 | 31,154 | 31,791 | 33,055 |
| Community Treatment Orders (CTOs) Issued | 725 | 757 | 802 | 843 |
| Addiction Residential Treatment & Detoxification Admissions | 10,557 | 10,356 | 8,166 | 9,254 |
| Workforce | ||||
| AHS Physicians | 7,999 | 7,987 | 8,792 | 8,697 |
| AHS Staff | 102,717 | 103,340 | 108,689 | 112,373 |
| AHS Volunteers | 14,117 | 16,020 | 12,241 | 9,186 |
Data updated as of May 11, 2022. Definitions can be found at Provincial Quick Facts.
* The measure “Health Link Calls” is no longer being reported because Health Link has expanded their services and this measure no longer represents the Health Link business. This measure was changed as of 2021-22 Q1 to four separate measures: 1) “Health Link Calls Received - Clinical”, 2) “Health Link Calls Received - Non-Clinical”, 3) “Health Link Outbound Calls - Clinical”, and 4) “Health Link Outbound Calls - Non-Clinical”. Data for the measure “Health Link Outbound calls” (clinical and non-clinical) are only available at a provincial level. ‘Clinical’ refers to calls requiring nursing, addiction and mental health, COVID-19 clinical services, rehabilitation, etc. ‘Non-Clinical’ refers to calls requiring information and/or referral, influenza, COVID-19 non-clinical services, tobacco cessation, immunization booking, etc. Health Link call volumes include COVID-19 inquiries and vaccination appointment booking (beginning 2019-20 Q4).
** Source: Alberta Health Influenza Immunization Report 2020-2021. 2021-22 Immunization data was not available at the time of reporting, data will be updated as soon as possible.
AHS continues to shift from a focus on providing care in hospitals and care facilities to providing resources and services in the community. We are committed to providing community-based care options for Albertans, including long-term care, designated supportive living, palliative care and home care. In 2021-22, AHS opened 387 net new continuing care beds. Increasing community capacity means that people are gradually being moved from hospital settings to a more appropriate (and often more cost-effective) community-based setting. Additional information on bed capacity can be found in Supplemental Information to the 2021-22 AHS Annual Report.
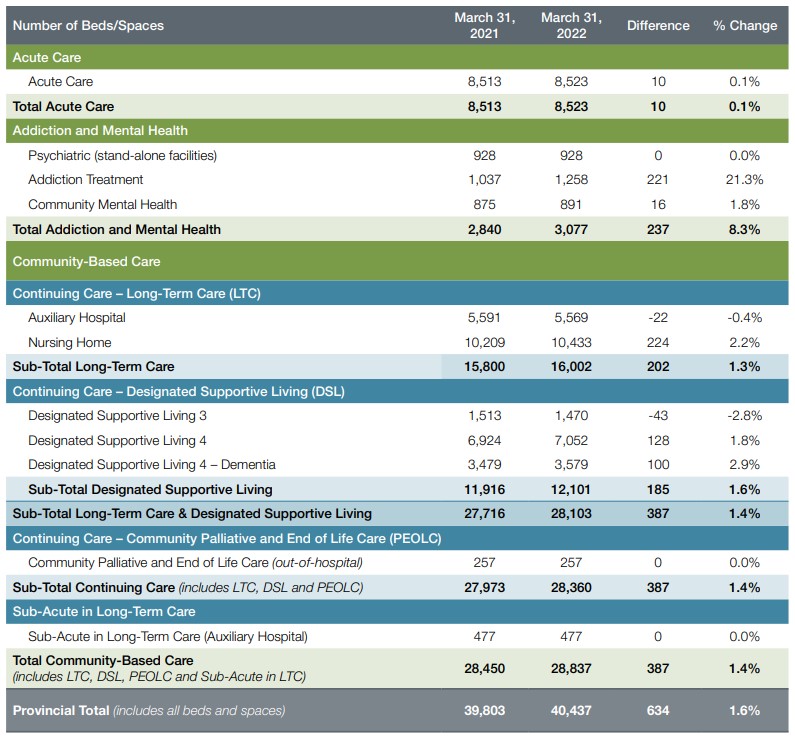
Source: AHS Bed Survey as of March 31, 2022.
Note: Beds may have been restated since previous AHS Annual Reports and AHS Bi-Annual Bed Surveys due to reporting corrections.
Of the 8,523 acute care beds, 6,089 are non-ICU COVID-capable, 173 are ICU and 217 are specialty ICU.
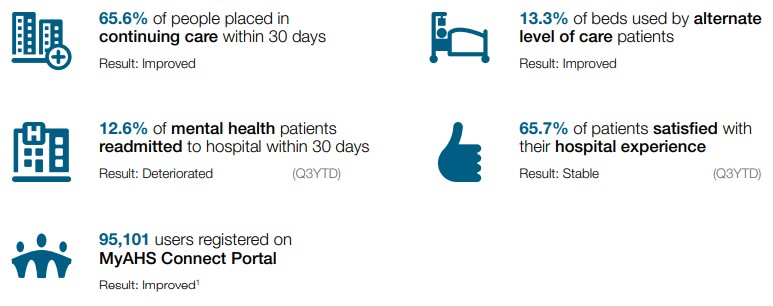
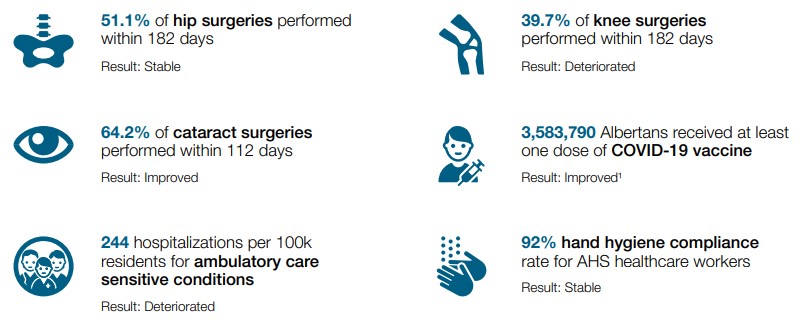
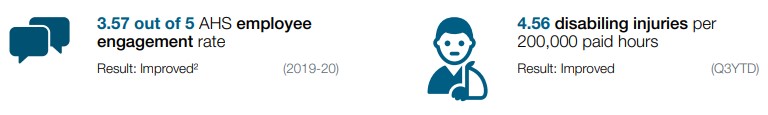
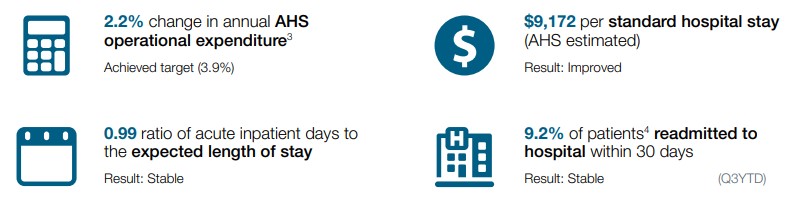
Year-end results for AHS’ performance metrics are summarized below. Results are reported as ‘improved’ if there is a three per cent or greater relative change in a desirable direction when compared to the same time period last year; ‘deteriorated’ if the three per cent or greater relative change is in an undesirable direction; otherwise, results are reported as ‘stable’. Additional information can be found in the Supplemental Information to the 2021-22 AHS Annual Report.